Thursday, November 5, 2009

Data Jewelry


Here is a novel data representation, high and low temperatures over the course of a year are laser-cut into small house-shaped slices that encircle the bracelet. Also shown are small circular holes with area proportional to the monthly rainfall. A flattering year's worth of weather data to wear on your wrist. See details here.

Tuesday, November 3, 2009

Time Series Heat Map in R


The Revolutions blog gives information on the statistical programming language R. Heat maps are shown in a recent post. A calendar is displayed horizontally with days of the week in rows and months arranged in jagged columns (since not all months have the same number of days). A color is plotted on each month's day for the magnitude of a time series variable (in this case the stock price for Microsoft) over several years of calendars. The site gives R code developed by Paul Bleicher, MD PhD, Chief Medical Officer at Humedica for producing these plots.

Thursday, August 13, 2009

A Normal Sidewalk?


I've seen this pattern in many sidewalks. A crack forms at the seam of two pieces of concrete. Over time and use the crack crumbles away portions of the sidewalk in a bell-shaped pattern. What process or differential equation might define the resulting bell-shaped pattern of wear?

The Density of Space Trash


Here is an image showing the density of space debris in low earth orbit. Notice that this density has a very long, and likely heavy, tail that is not shown. Geo-synchronous satellites orbit at 36,000km well off the upper range of this graph (2,000km). There would be a large bump in the density at 36,000km. From The Washington Post.

Wednesday, August 12, 2009

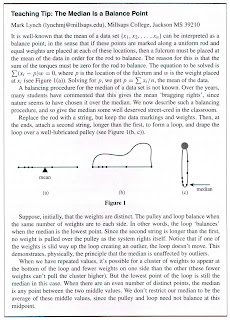
A Pearl: a Balanced Median Necklace


The September issue of The College Mathematics Journal has this balance point view of the median by Mark Lynch of Millsaps College.

Monday, July 27, 2009


Wine consumption for various countries proportional to the area of each circle. Strangemaps.wordpress.com has an interesting discussion of trying to make sense of the numbers in this map that has no legend to tell you what the numbers mean. Why is Luxembourg so big?

A Sad Tally Indeed

Discrete distribution of Golden Gate Bridge Suicides. Locations plotted to the nearest light pole. The bay side is more popular than the ocean side. Any conjectures as to why? From strangemaps.wordpress.com via sfgate.com

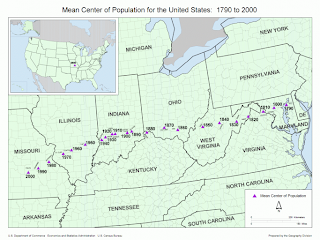
A Mean Streak Across the Country


The mean center of population for the US. From the US Census Bureau: “the point at which an imaginary, flat, weightless and rigid map of the US would balance perfectly if weights of identical value were placed on it so that each weight represented the location of one person on the date of the census.” From strangemaps.wordpress.com

Delay

Sorry for the long break. Life interfered.

Tuesday, February 24, 2009

It's Easy as 1,2,3


Graphical rating of movie trilogies. From Danmeth via notcot.

Saturday, January 31, 2009

The Super Big Bowl Game


The Super Bowl, excuse me, I should have said The Big Game, (since the NFL restricts their copyrighted name from all but their officially endorsed advertising), is tomorrow. The Pittsburgh Steelers play the Arizona Cardinals in Tampa. The Steelers home is Heinz Field shown in this view from Google Earth in 2006. Look at the two prominent areas of wear along each sideline of the field. These sidelines are where the players, coaches, and trainers watch, wait, and often pace as the game progresses. These areas of wear show us the frequency distribution of this sideline action. Coaches and players move up and down along the sideline following the action on the field. As they do so their steps wear away the turf underneath leaving a record as frequency distributions; more wear indicating a greater frequency of use.

If you look closely you can also see a wear pattern of the team's use of the field during play.

Friday, January 30, 2009

Microbes illustrate Simpson's Paradox


An article in Science by Chauang, Rivoire, and Leibler illustrates Simpson's paradox with a microbial system. They describe the principles with the illustration above from their paper. On the right three subpopulations undergo decreases in their percentage of green, but because of unequal weighting of the subpopulations the global population undergoes an increase.