This is a ladder leading to an elevated playhouse for kids visiting Brookside Gardens in Maryland. The ladder reveals a frequency distribution of foot placement wear. On most steps we see more wear in the middle of the ladder rung and less wear towards the left and right edges. This leaves a bell-shaped pattern of use.
But a rung near the bottom has a bi-modal pattern, showing the wear resulting from both left and right feet. This doesn't persist on higher rungs. There the wear seems more central. So why not on the lower rung as well? Perhaps central steps on higher rungs feel safer. A care that is not that needed closer to the ground.
Monday, October 31, 2016
Monday, October 24, 2016
Guitar Fret Wear?
Monday, October 17, 2016
Fair, Minimal Symmetry Dice
Tuesday, October 11, 2016
Menu Basket Queue
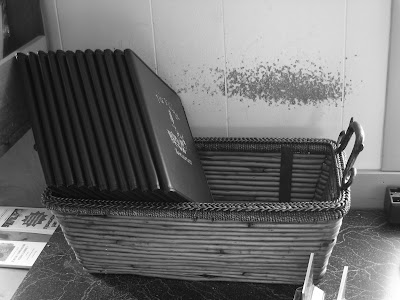
This is a view of a basket of menus at a restaurant in
Chincoteague, Virginia. Notice the pattern of marks left as groups of menus scratch
the wall when they are returned to the basket. As customers are seated at the restaurant, they are given
menus that are removed from the right hand side of the basket. After ordering, the menus are returned to the basket and placed to the right of the remaining menus. When a single is menu returned, it nicks the wall at a location that depends on how
many menus are currently in the hands of customers. If few menus are out with
the customers, more remain in the basket and the wall marks of this returning
menu will be further to the right. If many menus are out with customers, say just before the lunch rush, this returning menu will make a
mark on the wall further to the left.
But it is not often that a single menu is returned alone. It is much more likely that a group of menus will be returned to the
basket in a bunch. The size of the bunch that is returned is random depending
on the size of the party seated. Each of the menus in the bunch makes a mark on
the wall as they are returned to the basket. What we see is a steady state
distribution of the number of seated customers, with menus in hand, waiting for
their order to be taken.
Labels:
discrete,
distribution,
frequency,
queue
Monday, October 3, 2016
Manhattan Metric 2
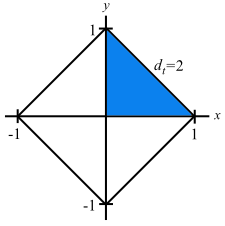
The image above is a Google Earth view of the parking lot of an office building in Maryland. Commuters have parked their cars to enter a building just off the image at the lower left. They must follow perpendicular paths and walk between the cars and/or along the lanes to enter the building. But to minimize the distance of the walk, most have parked along lines of equal distance from the bottom left according to the Manhattan or city block metric. A few stragglers don't fit this pattern, perhaps wanting to protect their cars from door dings or just get a little extra exercise. But the prominent pattern in the image above is one quadrant of the rectangular 'circle' of the city block metric.
This line graphic from Taxicab Geometry.
Labels:
city block metric,
manhattan metric,
taxicab metric
Subscribe to:
Posts (Atom)


