Monday, March 31, 2014
Kitchen Distribution
Here is a well-used cutting board. Every morning it protects the counter top from an errant knife cutting slices of bread for breakfast. The loaf is most often placed so that the cuts fall near the middle of the board, with the knife's blade repeatedly marring the front edge of the cutting board. Less often the cuts continue and extend off to the right or left of the middle. In this contest right seems to win out. This leaves us with a frequency distribution of the knife's marks skewed a bit to the left: the fewest marks along the left of the front edge, the most along the middle, and then a bit fewer marks on the right of the edge. This is a bell-shaped, although somewhat skewed to the left, pattern that we've seen often.
Labels:
bell-shaped,
distribution,
frequency,
skew
Monday, March 24, 2014
Quantifying Selfies
Selfiecity.net is a project that quantifies many aspects of selfie portraits in five cities around the world in plots of various frequency distributions. The image above shows a dot plot of the estimated age of selfie subjects. In this image 61.6% of the selfies analyzed are from women and 36.7% are from men. The average estimated age of the women is 23.3 years and for men 26.7 years. Scrolling over the dots in this plot show the actual selfie that is measured.
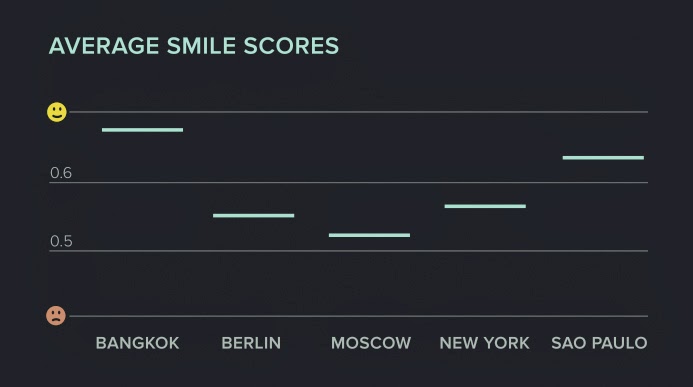
This image assesses the mood of the selfies and plots them on a smile scale from frowning to smiling. Another plot shows the smiles ratings across the cities.
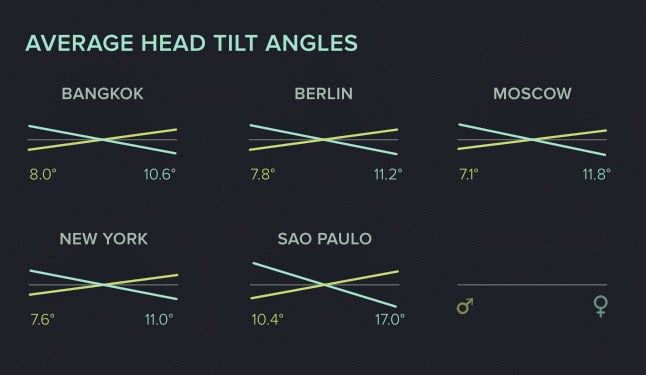
There are even plots that assess the tilt of the subjects head in the selfie, showing that on average women tilt their heads more than men. This is a fun project. Perhaps some of the participants could use the Selfie Help Book!
Monday, March 17, 2014
In Honor of Pi Day last Friday
In honor of Pi day this past Friday, March 14. I posted this long ago in 2008. It is still my favorite pie chart.
Monday, March 10, 2014
Conditional Probability
Here is a clever, interactive, simulation display of conditional probability from Victor Powell, via flowingdata.
Balls fall from the sky, uniformly distributed across the display window. Some hit a red shelf of adjustable width. Here it is set at a width so that
P(A) = 20% of all the falling balls hit the red shelf.
Another lower blue shelf, overlapping a bit with the red one, is set so that
P(B) = 12% of the balls hit the blue shelf.
A mere P(A and B) = 6% of the balls hit both shelves, indicated by the mixture of red and blue to get purple. But, as the simulation says,
"If we have a ball and we know it hit the red shelf, there's a 30.0% chance it also hit the blue shelf" and
"If we have a ball and we know it hit the blue shelf, there's a 50.0% chance it also hit the red shelf".
Below are connected bars showing, by their length, the color composition of the dropped balls. We can easily see how these proportions are obtained by visually estimating that fraction that purple makes up of the balls that hit the red shelf. That is the ratio, purple / (red + purple) = 30% or what fraction purple makes up of the balls that hit the blue shelf. This is the ratio, purple / (purple + blue) = 50%.
Labels:
compositional data,
conditional,
probability
Monday, March 3, 2014
Dancing Statistics
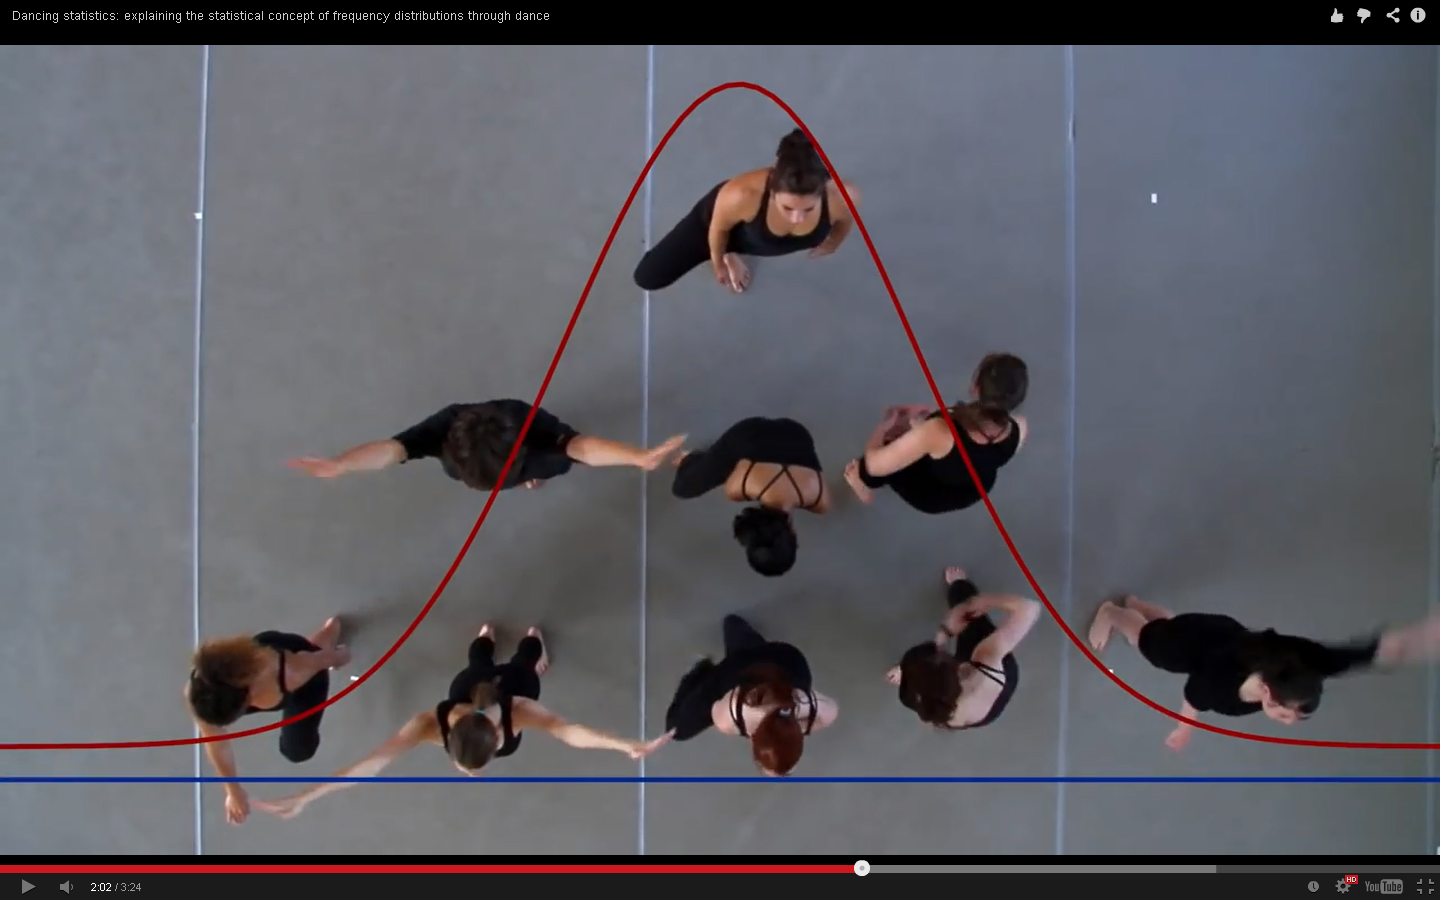
A still image from the project Communicating Psychology to the Public through Dance, produced by Lucy Irving, Elise Phillips, and Andy Field supported by the British Psychological Association and IdeasTap. Four videos: my favorite Frequency Distributions, Sampling and Standard Error, Variance, and Correlation.
In this image from the first of the videos the dancers start our in one large unorganized group, some dancing with very slow movements, some with very quick movements, and as one would then expect more with movements of a more intermediate speed. As they dance they sort themselves out, from the slower movement dancers on the left, to the more rapidly moving dancers on the right, building up a sample from a bell-shaped distribution. Very clever.
There is a video about correlation with dancers performing the same movements together or nearly opposite movements together. As they mention in the text of the video, these movements are just co-occurrences, one does not cause the other: correlation is not causation.
There is a video about variation with dancers performing variations on the same set of movements.
Another is about sampling and standard error. In this dance, a single blue-shirted dancer performs his movements to indicate the four corners of a rectangle. He and the rectangle defined by his movements are termed the population. Then several red-shirted dancers mark four corners in their own styles producing various quadrilaterals that estimate the rectangular shape of the blue-shirted dancer.
I do think calling that initial, single blue-shirted dancer a population could be misleading, especially since at the beginning of this video the text mentions "a large group (a population)". This, of course, is the usual view: the large group is the population from which we observe samples to estimate it. But perhaps better, in this setting, would be to talk more generally about a statistical model. This is a model for a dancer's movements. These movements depend on the physical aspects of the dancer: height, limb length, reach, flexibility, etc. They also depend on artistic intent, style, technique, etc.
The blue-shirted dancer specifies the results of a certain collection of all of these aspects. This becomes a parameter, a target. The red-shirted dancers sample from the model of movements to estimate this parameter. The variety and range of their movements display the sampling variability as they attempt to match the governing shape (parameter) of the blue-shirted dancer. This view is more general than the viewing of sampling as from a fixed large group population.
Subscribe to:
Posts (Atom)


