Not statistical, but I love this stuff.
Monday, December 28, 2015
December Paradox
Not statistical, but I love this stuff.
Monday, December 21, 2015
Monday, December 14, 2015
Timeline of Statistics
Above is a portion of the Timeline of Statistics by the American Statistical Association and the Royal Statistical Society printed in the December 2015 issue of their magazine Significance. The full timeline by designer Tom Fryer can also be examined here. This follows the 1960's timeline design by Charles and Ray Eames for IBM called Men of Modern Mathematics, now it's an iPad App called Minds of Modern Mathematics.
Monday, December 7, 2015
Monday, November 30, 2015
How to lie, no, display data in context
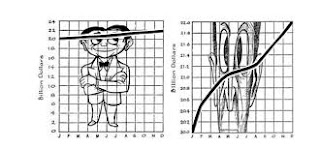
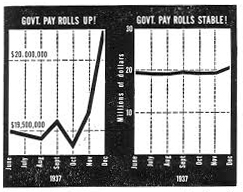
These are figures from the classic book "How to Lie with Statistics" by Darrell Huff. They illustrate an admonition against a dramatic scaling of a line graph (and also a bar graph) by not including zero on the vertical axis. This omission has long been a staple of those who want to mislead but, as the video from Vox below explains, often for their graphs, or charts as they call them, it is not always wrong to omit zero. Seeing the data in context is what's important. I especially like the illustration of plotting body temperature on the Kelvin scale. We should keep in mind the phrase attributed to the late Harvard statistician Frederick Mosteller, "While it is easy to lie with statistics, it is even easier to lie without them."
Labels:
bar chart,
graph,
video,
visualization
Monday, November 23, 2015
Hungry Thanksgiving
Above is a map from Five-Thirty-Eight's survey of Thanksgiving eating traditions nationwide. It shows the most disproportionately common Thanksgiving side dish by region. I grew up in Florida, but we never got on the mac and cheese Thanksgiving bandwagon. Likewise, living now in Maryland, squash doesn't make it on our plates. Our family seems to match the midwest more, with green bean casserole and rolls (not biscuits). And for dessert we are looking forward to pumpkin, pecan, and apple pie. You can download their survey data for your own analysis here.
Monday, November 16, 2015
Independence in the Trumans' Wallpaper
This is a view inside the kitchen of President Harry S
Truman’s home in Independence, Missouri, courtesy of the National Park Service.
Notice the pattern of wear in the wallpaper from pulling the
chain to turn on the wall lamp. Here's a close up:
When Harry Truman left the Presidency he retired to a very
modest and quiet life. He lived with his wife Bess in her family’s home in
Independence, Missouri. He read five newspapers a day, no doubt many at the
table shown in this photograph. One can imagine their morning routine of taking
a seat at the kitchen table with a cup of coffee leaning against the kitchen
wall and reaching up to pull the chain to turn on the lamp above the table. In
so doing perhaps knuckles hit the wall or the chain rubbed the wallpaper and
wore it through. This resulted in a clustered pattern of wear from the pulling
the lamp’s chain and releasing it. But the wear on the wallpaper suggests that
this targeting was not always exact and the release, in hitting the wall was
not always consistent. These small, accumulated errors left a record over their
many morning reads.
Such a targeting routine gives rise to the normal,
bell-shaped pattern of wear that we have seen before. Only this time it
develops in two dimensions. With a few assumptions we can derive the normal
probability distribution that models and describes these actions.
In reaching for the lamp’s chain, perhaps the Mr. Truman’s
morning grogginess or intense attention to the news of the day, caused him to
miss the target, reaching just a little too far to the left or a little too far
to the right to grab the chain. Likewise, his marks indicate that his reach was
sometimes a little too high or a little too low.
Let us first assume that these small errors, right and left
or high or low are independent of one another. This independence means that if
his reach was too high one morning, this had no affect on how the reach left
its mark when the light was turned off later in the day or on the next morning.
He didn’t repeat the same too-high reach the next morning nor did he overly
compensate and leave a mark too low the next.
But this Independence goes beyond Missouri, it goes further than day to day
variations. It applies more importantly to each individual action of turning on
the lamp. We assume that at each targeting of the lamp’s chain their right to
left targeting is independent of the up and down targeting. They are not consistently
grabbing slightly up and simultaneously to the right nor slightly down and at
the same time to the left. On the contrary, independence would dictate that the
other two possibilities of slightly up and to the left or slightly down and to
the right are equally represented motions. These independent actions leave
their marks on the wallpaper in the clustered pattern of roughly circular
shape. The pattern has no tendency to tilt up or down to the right or the left.
Next, since turning on a lamp is such a routine and repeated
task, it is much more likely that their targeting error was small rather than
large. It would be very unlikely that a reach would leave a mark far from the
target chain. It is much more likely that they left a mark resulting from a
small error in targeting. So our second assumption is that, the bigger the
error, the less its chance of occurrence. Small errors are much more likely.
Now, imagine that a high reach is just as likely as a low
reach. Likewise, a reach to the right of the target is just as likely as a
reach to the left. This would say that the marks fall symmetrically around the
target and that the probability of a particular size error to the right is the
same as the probability of the same size error to the left.
But here we make an even stronger assumption. Let us assume
that errors at any given distance from the target have the same chance of occurrence
in whatever direction they may land. This would mean that not just horizontal,
right and left errors or vertical, up and down errors are considered. Targeting
errors along any tilted diagonal are also possible. After all, Mr. Truman could
have occasionally reached a little to the right and a little too high falling
northeast of the target. As we’ve said it does not appear that they did this
consistently, but however far in this tilted direction a mark was eventually
made, we assume that the chance of such an occurrence is the same as the chance
of an equally distance mark in a purely horizontal or vertical direction. What
matters is not the direction of the error whether up, down, right, left, or
diagonally. What matters is only how far the error is from the target. The
chance of occurrence of any error depends only on how far it is from the
target.
We have these assumptions: 1) independence of horizontal and
vertical targeting, 2) smaller errors are more likely than larger ones, 3)
errors the same distance from the target have the same chance of occurrence and
finally 4) the resulting probability density function that describes the
results of these targeted actions is always positive, that is, no targeted
misses are excluded from possibility. With these assumptions the bivariate
normal probability density function can be derived.
In fact, this result has a long history. It has been derived
many times and used in many contexts. It is most notably attributed to Herschel
(1850), but was developed much earlier by Adrain(1805).
Let x represent
the horizontal position and y
represent the vertical position of a targeting mark. Let f(x) (or f(y)) denote the
probability density of the horizontal (or vertical) position. Independence tell
us that the probability of the joint positions of x and y, denoted by their
joint probability distribution, g(x,y), can be
represented as the product of probability distributions for x and y individually. That is, g(x,y) = f(x) f(y). But we also have the assumption that the probability
distribution of the joint position of x
and y depends only on the distance
from the target origin. So that,
for some function h. If we let y = 0 then we see that h(x) = f(x) f(0).
Now define
But the well known solution to such a functional equation is
given by the linear function
k(x) = cx, for some constant c.
Then
We have a probability density (i.e. one that integrates to 1)
only if we use our second assumption that larger errors are less likely to
occur than smaller ones. This says that we must have c to be
negative. We can write such a negative constant as
for some
standard deviation  . Then the function f(x) takes the form
This is
exactly the probability density function of a normal random variable. To find f(0) we note
that the area under a probability density must be one. This results in a properly scaled probability density
for our horizontal (or vertical) position:
This is the normal, bell-shaped probability distribution,
centered at the origin and having a standard deviation of  . The two-dimensional wallpaper wear pattern can then
be considered a sample from the bivariate normal probability distribution
This same quantitative argument was also used by James Clerk Maxwell in 1860 in his study of the kinetic theory of gasses.
There is more to see here. Notice the stains on the wall above each chair, about at head level. Was this
the result of resting groggy, early morning heads? Next, close inspection might discern greater variability and
therefore a wider spread of marks on the wallpaper in the left to right
direction compared to the up and down direction. This concerns the behavior of
those individual directions separately. One may be spread out a bit more than
the other, that is, the horizontal direction might have a larger standard
deviation than the vertical direction. Although this changes the expression of
the bivariate normal density, with our assumptions, it is still normally
distributed. The key requirement is the independence of the directions. Independence
is concerned with how the up and down or left and right directions of action
behave together and leave their marks. We would doubt independence of these
individual motions only if they consistently left marks in a tilted directional
pattern, rather than just the possible stretched direction seen here.
Finally, the National Park Service Rangers tell me that
President Truman and his wife picked out this wallpaper in 1971. Mr. Truman
died in 1972. His wife Bess Truman likely sat at the same table, until her
death in 1982. A large portion of the wallpaper wear shown here is most likely
due to her turning the lamp on and off.
Labels:
bivariate,
distribution,
independence,
normal,
probability
Subscribe to:
Posts (Atom)


