Monday, February 29, 2016
Scattered Dimples
Here is a bivariate, skewed distribution of finger wear and motion in taking a receipt from a gas pump in Greenfield, Indiana. Most wear is from fingers pushing down on the gas receipt as it exits the dispenser. There is some left-to-right variability in this placement, and many customers have dragged their fingers further downward to capture the receipt. This leaves an elongated, skewed pattern of wear from top-to-bottom. The dimpled surface of this pump also leaves the impression of a skewed scatterplot of individual points. We have seen wear patterns on gasoline pumps before.
Labels:
bivariate,
distribution,
scatterplot,
skew,
variability
Monday, February 22, 2016
Scuff and Wear
This is an doorway threshold between two rooms of a thrift store in Easton, Maryland. People step on or over scraping their feet on both sides of the edges of the raised threshold. More frequent steps and wear in the middle and fewer steps and less wear on the left and right edges all scuff away the black painted wood revealing a bell-shaped frequency distribution of wear.
Monday, February 15, 2016
Mesmerizing Movement
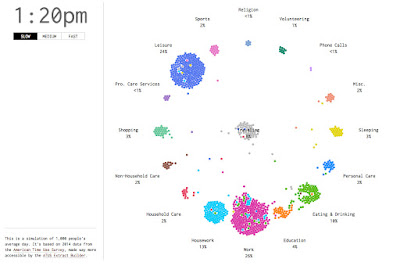
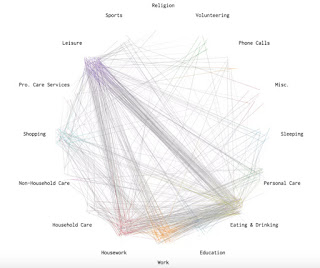
Nathan Yau of Flowing Data has put together an enthralling dynamic display of a Markov Chain of 1000 points simulating US Americans as they move through activities during their day. Color indicates activity and as this activity changes, the points move to another cluster. At rush hours and lunch there is a flurry of movement as points move from home, work, eating, leisure, etc. Leisure collects most points in the early evening, until late at night when most end up in a large yellow sleeping cluster on the right. It's captivating to watch the swirl of activity but also hard to follow anything but the biggest patterns of movement. To address this he also has static views of the paths the points take.
Eating, work, housework, and even leisure dominate this lunch hour view. See more here.
Monday, February 8, 2016
Correlation Guessing
Guess the Correlation is a game that asks you to do just that. Scatter plots are displayed and you respond with your best guess of the correlation. I found that I was consistently over-estimating the correlation. Perhaps I can train myself to make better guesses.Via Flowing Data.
(With the 8-bit graphics, this game looks like it was made in the 1980s for the Mario Brothers).
(With the 8-bit graphics, this game looks like it was made in the 1980s for the Mario Brothers).
Monday, February 1, 2016
Learning The Alphabet
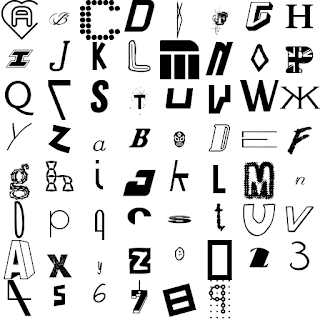
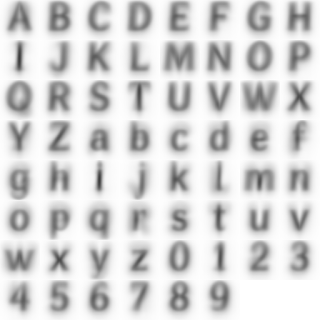
Software engineer Erik Bernhardsson took a sample of 50,000 fonts, with characters as varied as shown in the compilation above, and looked for basic underlying structure with a neural network. A neural network is statistically a linear combination of nonlinear functions of linear combinations of input variables. Here, the input variables are digital images of each font character expressed as vectors. Iterative adjustment, termed learning, is applied to produce a linear combination of the inputs. An output estimate of the input character is computed from the other set linear coefficients. All coefficients are chosen to minimize a measure of lack of fit. Bernhardsson then looked at the mean and median of the resulting output characters.
Mean of all the output fonts.
Median of all the output fonts.
Note how readable the mean and median fonts are, when the individual input fonts are extremely varied, as shown above in the first image. He goes on to interpolate fonts, apply random perturbations, and even generate new fonts by sampling from a multivariate normal distribution of the font vectors.
A mean of a collection of fonts we have seen before using a technique of simple visual averaging.
Labels:
mean,
median,
multivariate,
neural network,
nonparametric,
normal,
regression
Subscribe to:
Posts (Atom)


