Monday, May 31, 2010

Bell-Shaped Animals


Adapted from a graphic in Life magazine October 10, 1955 showing speeds of various animals. The artist has displayed the animals sampled on a horizontal scale of speed. There are few slow animals on the left, many more medium speed animals in the middle, and few fast animals on the right. The outline of the cloud of animals shows the essence of a roughly bell-shaped frequency distribution with a little skewness to the right. But take out the elephant and much of the skewness goes away also.

Thursday, May 27, 2010

Artificial Population Sampler


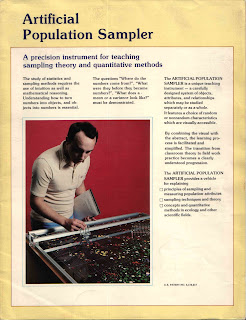
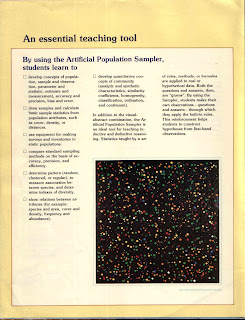
I found this brochure in an old file. It dates from 1978. It shows a physical model for teaching sampling and quantitative methods in ecology. Click on the images for larger views. Developed by Arnold M. Schultz, a Professor of Systems Ecology at the University of California, Berkeley and used as a teaching tool beginning in 1958. His 1961 patent application seen here was awarded in 1965.

The model contains two plates of plastic containing arrangements of vinyl discs of various sizes and colors that represent populations in a square region of the Cartesian plane. One plate is called the random population plate made up of six colors that seem to be distributed uniformly over the square. The other plate is called the nonrandom population plate made up of 19 colors that are arranged in rough clusters to illustrate more contiguous, local populations. Instruments are provided for measuring locations and size. Along with color they provide both qualitative and quantitative data for estimating means, variances, density, diversity from various random sampling methods. The population parameters are fixed in each of the plates allowing assessment of measurement error and bias. A paper by Schultz et al. from the Journal of Range Management (1961,v14,n5,pp 236-242) illustrates its use. I've found one listing of the color distribution (from the paper "A comparison of techniques for assessing dispersion patterns," D.W. Goodall and N.E. West, Vegetatio, (40)1:15-27, 1979) but other than a reference to it having six sizes, nothing explicit about the size distribution.

A real hands-on approach to sampling that is very useful for both teaching and research. An example in teaching is illustrated here. Its use in ecological research in 2006 is shown here.

Wednesday, May 26, 2010

Compositional Eating


Are you eating right? This site has dinner plates that graphically help you to keep to certain eating proportions. Of course, you must be careful not to pile-on and overload one section and skimp on others. The area devoted to your food choices might be a good reminder, but it's more the mass of each component that's important to your nutrition.

Thursday, May 20, 2010

Footsie?


Distributions of foot placement, sitting on a bench, in a casino "on the Boardwalk in Atlantic City"

Monday, May 17, 2010

Old School Rules: A Normal Slide Rule


Here's a normal slide rule. Yes, it's very old technology, but it helps to see some workings that other high-tech black boxes hide.
Of course you can even get much more extensive stat calculators for your IPhone See StatsMate. Still this is fun.


Find the BIG TIF file at this link (or click on the illustration below). And, as requested, here is a smaller pdf version. Print it out on heavy card stock.


Cut off the slider on the left and set it aside. On remaining front section, cut out the normal curve and the results window. Fold back the top and bottom. Then slide in the slider with the numbers down and the blue rectangle up.
Pick your z-score and read the area of the blue shaded region.