Monday, January 28, 2013
Bird Parking
From the Washington Post last week Jan. 22, 2013. From an article by Petr Seba "Parking and the visual perception of space". He models the spacing between birds on a wire or cars parked on a street as a Gamma distribution. This is not like our usual images. The birds' positions on the wire is what we observe, much like a dotplot of many statistical packages: one dot on a number line for each data point. Here we have to consider the spacing between the birds or dots. This does not build up in accumulation like the wear patterns that we see routinely on doors, YADDA...Still it is a fun result.
Monday, January 21, 2013
YADDA BAM!
Yet Another Door Distribution Again. A bell-shaped wear pattern displaying the frequency distribution of hand placement on the exit door of Book-A-Million in Columbia, Maryland.
Labels:
bell-shaped,
distribution,
frequency,
YADDA
Monday, January 14, 2013
Sherlock Holmes quotes Sherlock Holmes crediting a Great Statistician
The TV series Elementary is a modern take on Arthur Conan Doyle's detective Sherlock Holmes. In the latest episode "M.", Sherlock Holmes played by Jonny Lee Miller quotes Sherlock Holmes from chapter 10 "The Sign of the Four," saying:
while the individual man is an insoluble puzzle, in the aggregate he becomes a mathematical certainty. You can, for example, never foretell what any one man will do, but you can say with precision what an average number will be up to. Individuals vary, but percentages remain constant. So says the statistician.He could be talking about the Law of Large Numbers or perhaps the Central Limit Theorem or, even more simply, any random variable with its individual values and its given probability distribution of the aggregate of its values.
In the book, Arthur Conan Doyle has Holmes reference the 19th century British philosopher, explorer Winwood Reade who wrote in his book The Martyrdom of Man:
All the events which occur upon the earth result from law: even those actions which are entirely dependent on the caprices of the memory or the impulse of the passions are shown by statistics to be, when taken in the gross entirely independent of the human will. As a single atom man is an enigma: as a whole he is a mathematical problem. As an individual he is a free agent, as a species the offspring of necessity.In the TV show, Holmes credits a "great statistician".
I like that.
Monday, January 7, 2013
Happy New.....Car
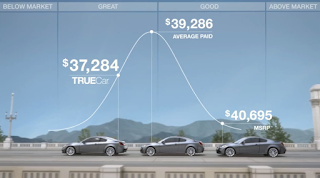
Over the holidays I saw a normal curve on a TV commercial. We've seen histograms in a TV role before. The new car site TRUEcar.com contains three versions of their TV commercials displaying normal curves representing the distribution prices of chosen car models. The screenshot from one of their commercials, shown above, displays car prices as a normal distribution. The distribution shows the Manufacturer's Suggested Retail Price (MSRP) sitting about two standard deviations above the Average Paid price and, predictably, the TRUECar price about one standard deviation below the Average. This is repeated in another normal curve show above.
This is nice to see, but I have a problem with it. For what are undoubtedly graphic designer concerns, the prices are shown as points on the normal curve itself, but they should be more properly represented on a number line that tracks along under the curve. We've also seen this problem illustrated before in this blog: here and also here. The difficulty is in confusing the height of the curve with the size of the price. True, a careful look would show this is not the case, but I wonder how many people still misinterpret this placement, thinking of one price sitting at the top of a heap, and that price is the mean!
TRUEcar improves this somewhat on their website where you can select a given make, model, and year of a car and they will display a histogram of either the national or local comparison distributions of prices paid, as shown below. National comparison prices are much closer to bell-shaped than the smaller sample of local prices.
The horizontal extent of each histogram bar represents a small range of prices paid by a number buyers. This number determines the height of the bar. You can slide your cursor to highlight the histogram bars as they range from Below Market (under the 15th percentile), to Great prices (between the 15th and 45th percentiles), to Good prices (between the 45th and 70th percentiles, finally up to prices that are Above Market (here above the 70th percentile, not as extreme as they showed previously).Here again is the potentially confusing placement of reference prices on the curve rather than on the number line of prices below the curve.
Still, it's good to see normal curves on national TV.
Happy New Year to all.
Labels:
bell-shaped,
distribution,
frequency,
histogram,
normal
Subscribe to:
Posts (Atom)


