

Devoted to images that illustrate statistical ideas
Showing posts with label galton. Show all posts
Showing posts with label galton. Show all posts
Monday, August 27, 2012
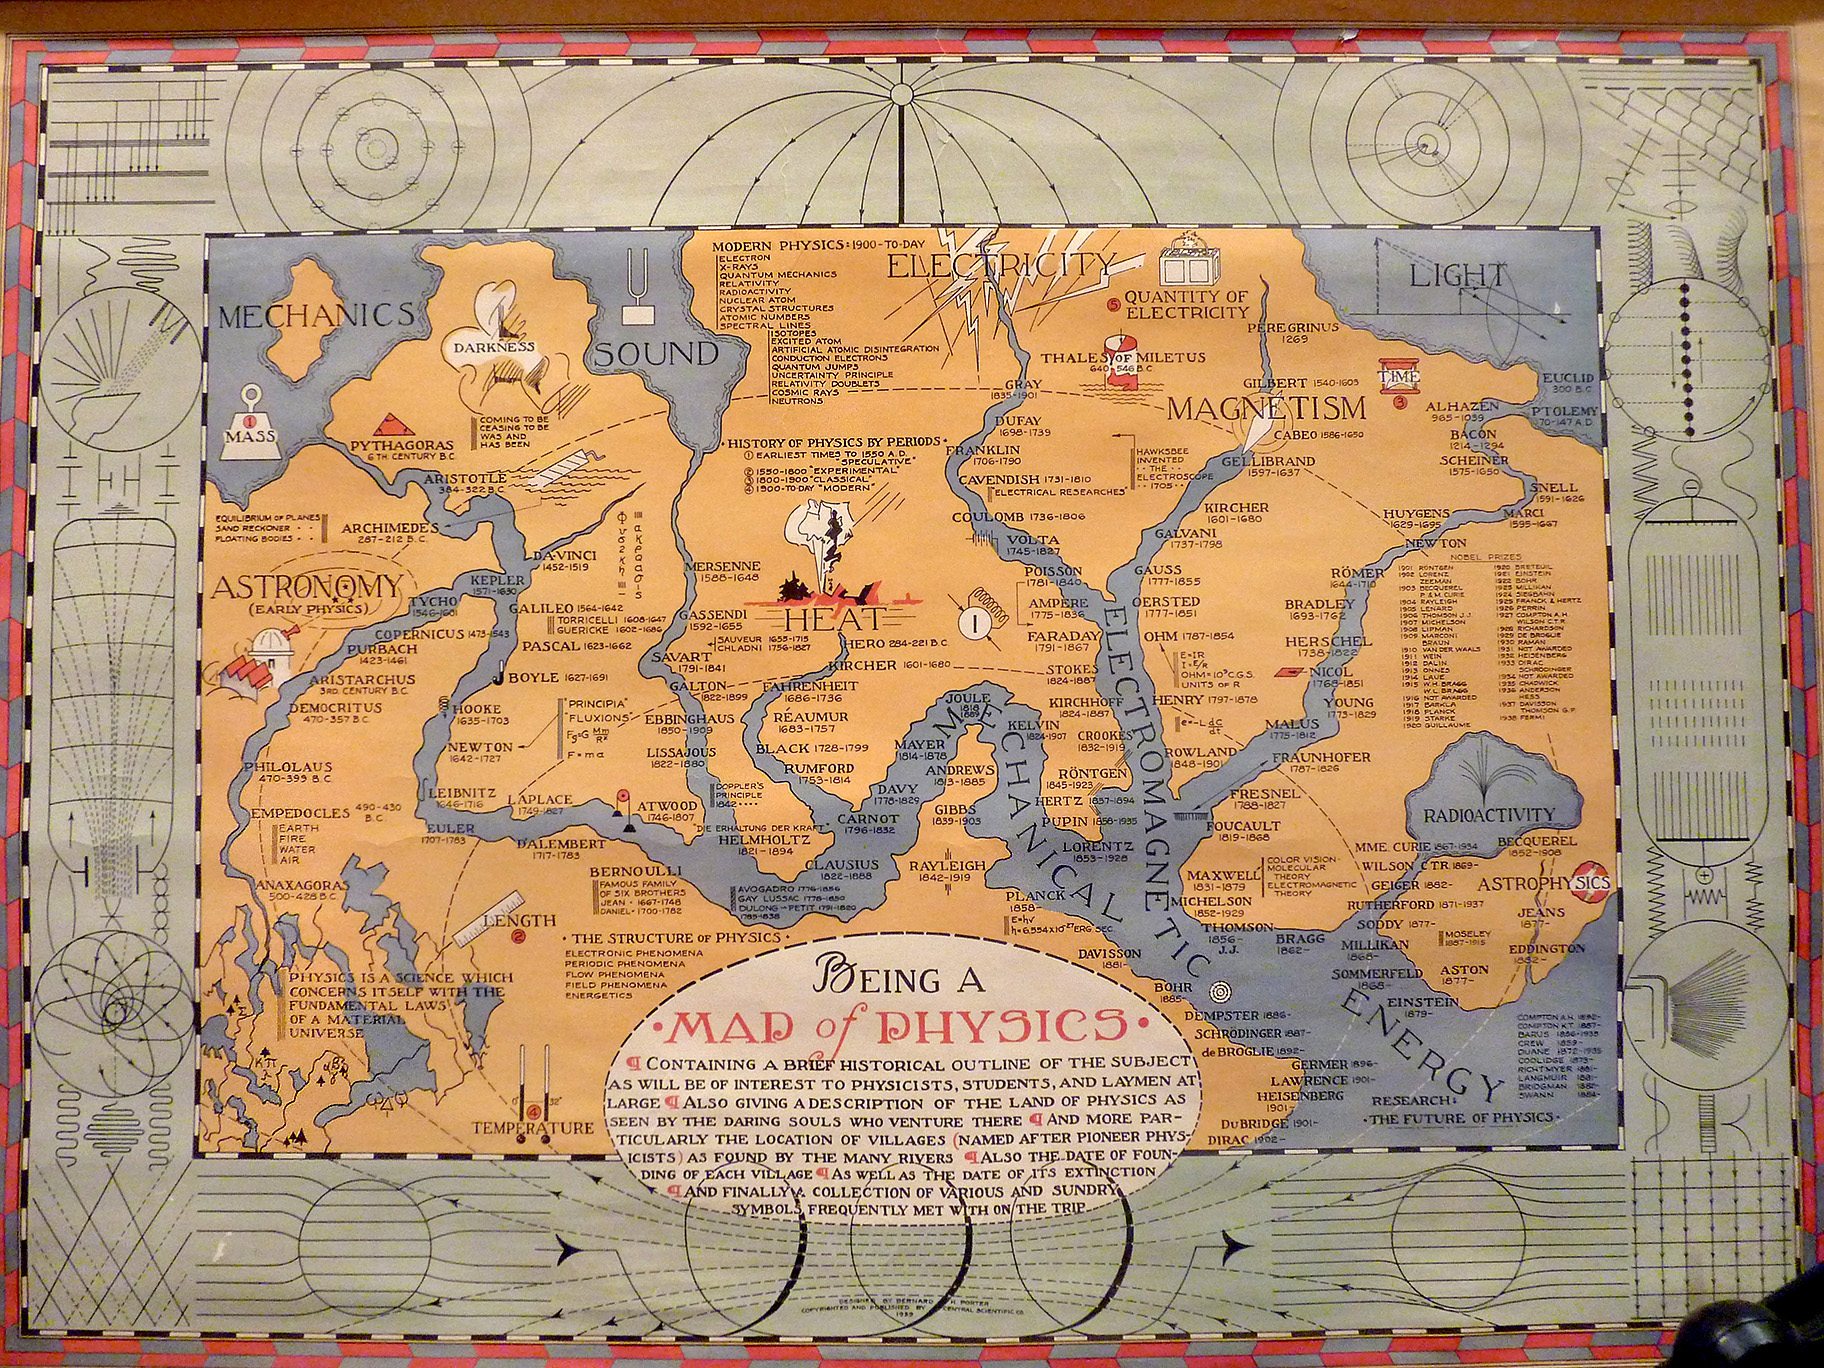
Physics as a Continent

Tuesday, August 7, 2012
Law of Large Crowds (Monty Pythony)
A NOVA video about the Wisdom of Crowds. In his paper "Vox Populi" published in Nature, March 7, 1907, Sir Francis Galton investigated this wisdom at a Fat Stock and Poultry Exhibition writing:
Galton received the 787 cards with the estimates and, then he tabulated results. The actual "dressed" weight of the ox was 1198 lbs. The median of the crowd's guesses was 1207 lbs., so the crowd was off by only 9 pounds out of 1198 or less than 0.8%. This was better than any individual guess, even from the experts. Galton also found the upper quartile (q3) of the guesses to be 1236 and the lower quartile (q1) to be 1162. Thus the inter-quartile range is 74. He modeled the data with a normal distribution and estimated its standard deviation as 1/2 of this inter-quartile range or 37, (he calls this the probable error, p.e.). We could be a bit more accurate by using 3/4 of the inter-quartile range. He notes the skewness of the distribution of guesses, with the lower portion best modeled with a normal distribution with a standard deviation of 45 and the upper portion best modeled with a standard deviation of 29. He graphs horizontally the cumulative distribution function of the fitted normal (solid line) along with the cumulative relative frequencies of the data (dotted line).In these democratic days, any investigation into the trustworthiness and peculiarities of popular judgments is of interest. The material about to be discussed refers to a small matter, but is much to the point. A weight-judging competition was carried on at the annual show of the West of England Fat Stock and Poultry Exhibition recently held at Plymouth. A fat ox having been selected, competitors bought stamped and numbered cards, for 6d. each, on which to inscribe their respective names, addresses, and estimates of what the ox would weigh after it had been slaughtered and "dressed." Those who guessed most successfully received prizes.


This result is, I think, more creditable to the trust-worthiness of a democratic judgment than might have been expected.
Subscribe to:
Posts (Atom)